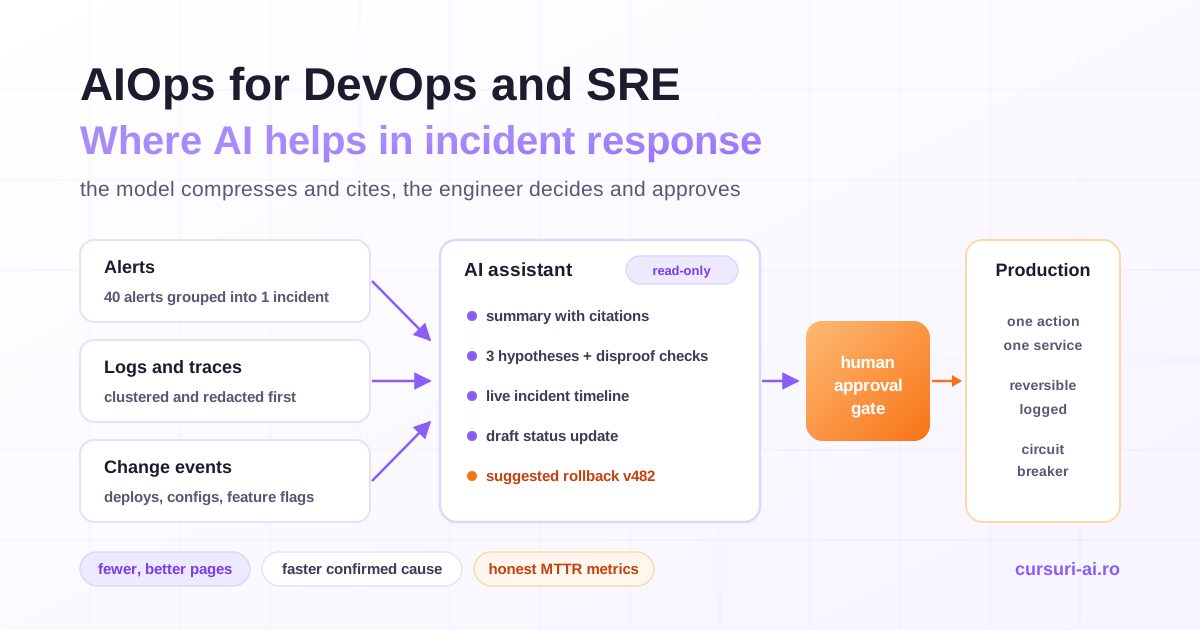
AIOps for DevOps and SRE teams has moved from a vendor buzzword to a concrete question: which parts of incident response can a model take over, and which parts must stay with the engineer holding the pager? The honest answer is that AI is very good at compressing information (thousands of alerts, log lines and spans into a short, cited summary) and still unreliable at deciding what to do to production. This guide walks through the incident lifecycle and shows where AI earns its place, where it needs a gate, and how to prove it helped without fooling yourself with a single MTTR number.
What AIOps means for DevOps and SRE teams today
Strip away the marketing and AIOps (AI for IT operations) covers four jobs:
- Observe. Collect metrics, logs, traces and change events with consistent metadata, so that anything downstream can correlate them.
- Detect. Find real problems earlier and with fewer pages, using SLO-based alerting, anomaly detection and correlation instead of a wall of static thresholds.
- Diagnose. Shorten the time from "something is wrong" to "we know what changed and why", by summarizing telemetry and proposing hypotheses with evidence attached.
- Act. Suggest, and only in narrow cases execute, remediation steps, behind approval gates, audit trails and a fast rollback path.
Two kinds of technology do this work, and it helps not to confuse them. Statistical methods and classical machine learning (forecasting, outlier detection, clustering) handle numbers at volume and are deterministic enough to sit in an alerting path. Large language models handle language-shaped work: reading log lines, explaining a stack trace, turning a plain-English question into a query, drafting a status update or a postmortem. LLMs are also the ones that produce confident, specific, wrong answers, such as a metric name that does not exist or a root cause that fits the story but not the data.
That is why the working stance in 2026 is assistive first. The model drafts and the engineer decides. A team gets most of the value long before any automation touches production, and the order in which you adopt the pieces matters more than the tool you buy. That order (telemetry, then detection, then assisted diagnosis, then narrow, gated automation) is the backbone of AI for DevOps and SRE: AIOps in Practice, and the rest of this article follows it through a real incident.
Step 1: Reduce alert noise before you add any model
Most "we need AI for our alerts" projects are really "our alerts are bad" projects. Google's SRE book sets the bar in its chapter on monitoring distributed systems: "Every page should be actionable," and "Pages should be about a novel problem or an event that hasn't been seen before." If your on-call engineers silence half their pages on sight, a model that summarizes those pages faster will not fix the underlying problem.
Three fixes come before any machine learning.
Alert on symptoms users feel, through SLOs. The Google SRE Workbook chapter on alerting on SLOs defines burn rate as "how fast, relative to the SLO, the service consumes the error budget," and recommends multiwindow, multi-burn-rate alerts. For a 99.9% SLO, its suggested starting configuration is:
| Severity | Long window | Short window | Burn rate | Error budget consumed |
|---|---|---|---|---|
| Page | 1 hour | 5 minutes | 14.4 | 2% |
| Page | 6 hours | 30 minutes | 6 | 5% |
| Ticket | 3 days | 6 hours | 1 | 10% |
The short window (one twelfth of the long one, per the workbook) makes the alert stop firing soon after the problem stops, which removes a large class of stale pages.
Group, inhibit and silence. Prometheus Alertmanager already does the deterministic part: grouping "categorizes alerts of similar nature into a single notification," inhibition suppresses notifications for some alerts "if certain other alerts are already firing," and silences mute alerts for a given time, which is how planned maintenance should be handled. A database outage that fires forty alerts across dependent services should arrive as one notification, not forty.
Feed change events into the same system. Deploys, config changes, feature-flag flips and scaling actions belong in your observability backend as events or annotations. "What changed just before this started?" is the highest-yield question in operations, and neither a human nor a model can answer it without that stream.
Where AI actually helps with alerts
Once the basics are in place, AI adds value in three places:
- Correlation into incidents. Learned or rule-based correlation groups alerts that share topology (this service calls that one), timing and a recent change, and opens one incident with the evidence, instead of three engineers chasing three symptoms of the same cause.
- Enrichment. An LLM can attach context a tired human would otherwise look up: the owning team, the last deploy to the affected service, the relevant runbook section, the current SLO burn, and similar past incidents.
- Anomaly detection on signals you cannot threshold. Seasonal traffic, multi-dimensional latency patterns and slow leaks are where statistical models beat hand-tuned limits. Keep these as tickets or enrichment at first; promote one to a page only after you have checked its false-positive rate over several weeks.
Measure alert quality with a short scorecard you review monthly: alerts per incident (high means poor correlation), the share of pages that needed a human decision, pages that turned out to be noise, and pages outside working hours. These numbers tell you whether the AI layer is reducing toil or just restyling it.
Step 2: Summarize logs and traces, with the evidence attached
During an incident, an LLM's most reliable contribution is turning a pile of telemetry into something a human can read in a minute: "6,200 connection timeouts to the payments database since 02:22, starting nine minutes after deploy v482; a smaller cluster of null-pointer exceptions in the checkout service began at the same time." Trace analysis works the same way: given the slowest spans for a request path, a model can point at the hop where latency appears and describe the pattern.
Three rules keep this useful rather than dangerous.
Deterministic first, LLM second. Use your log platform's own pattern clustering, counts and queries to reduce millions of lines to a few hundred representative ones, then let the model summarize those. Do not ask a model to "find the important line" in raw volume. A single rare line (an expired certificate, a permission denied, a security event) can be the decisive clue, and a summarizer that weighs lines by frequency will bury it. Keep an explicit query for rare and high-severity patterns that runs alongside the summary.
Ground and cite. The prompt should hand the model the actual query results and require a citation for every claim. A pattern that works:
You are assisting an on-call SRE. Use ONLY the evidence below.
If the evidence is insufficient, say so. Do not speculate.

CONTEXT: service=checkout, window=02:00-02:40 UTC
CHANGES: [deploy and config events in the window]
METRICS: [query results]
LOGS: [clustered, redacted log signatures with counts]
TRACES: [slowest spans with service and operation names]

TASK:
1. Summarize what is failing, citing the evidence line for each claim.
2. List up to three hypotheses, each with supporting AND contradicting evidence.
3. For each hypothesis, name one check that would rule it out.
4. Describe, but do not run, any action that would change production.
The two load-bearing instructions are "use only the evidence" and "cite each claim". Together they turn the output into something an engineer can verify in seconds, and they make missing evidence visible instead of papered over.
Redact before anything leaves your boundary. Logs and spans routinely carry tokens, connection strings, email addresses, user IDs and IP addresses. Under the GDPR, personal data includes information that identifies a person "directly or indirectly", including by "an online identifier", and the regulation's recitals name IP addresses and cookie identifiers as examples. The OpenTelemetry guidance on handling sensitive datais explicit that OpenTelemetry "can't determine what data is sensitive in your specific context on its own"; that is your job. The Collector gives you the tools: the attributes processor to hash or delete fields, the filter processor to drop whole spans or metrics, the redaction processor to keep only allow-listed attributes, and the transform processor for pattern-based changes. The official examples look like this:
processors:
  attributes/example:
    actions:
      - key: user.email
        action: hash
      - key: user.full_name
        action: delete
  transform:
    trace_statements:
      - context: span
        statements:
          - replace_pattern(attributes["client.address"], "\\.\\d+$", ".0")
Redacting in the Collector protects every backend at once, including the one your AI assistant reads from. If you send telemetry to a hosted model, the provider is processing personal data on your behalf, which under GDPR Article 28 calls for a processor contract, and your security team should confirm the provider's retention and training terms. For the most sensitive environments, a self-hosted or in-VPC model keeps telemetry inside your perimeter.
Step 3: Root-cause hypotheses, not root-cause verdicts
The phrase "AI root cause analysis" sets the wrong expectation. What a model can do well is propose ranked hypotheses quickly and assemble the evidence for and against each. What it cannot do is know that it is right. An ungrounded model asked "why is checkout slow?" may answer with a specific metric that does not exist in your system; the fluency is the trap.
A good AI-assisted diagnosis loop looks like this in practice:
- Start from the change log. Most incidents follow a change. The assistant lists every deploy, config change and flag flip in the affected services' dependency path during the window before onset.
- Correlate across signals. It checks which change lines up in time with the symptom, which services show the anomaly first, and whether the pattern appears in traces that pass through the changed component.
- Rank hypotheses with disconfirming checks. "Connection-pool exhaustion after v482 removed the pool cap" is a hypothesis; "pool utilization at 99% on payments since 02:22, and v482 diff shows the cap removed" is supporting evidence; "the same errors in a region that did not get v482" would contradict it. The assistant should name that check.
- Let the human decide. The incident commander chooses the mitigation. Mitigate first (roll back, shed load, fail over), diagnose fully later. An AI that keeps investigating while the human rolls back is helpful; an AI that delays the rollback to be sure is not.
Afterwards, the same assistant can draft the incident timeline from the channel and the tool calls, and a first postmortem draft in your template. Keep the review blameless and human-led: "root cause" is often several contributing factors, and the model will tend to produce a tidy single story because tidy stories are what its training rewards.
Step 4: Runbook automation with approval gates
Runbooks are where AI can save the most toil and do the most damage. The safe way in is an oversight ladder that you climb one action at a time, only as evidence accumulates.
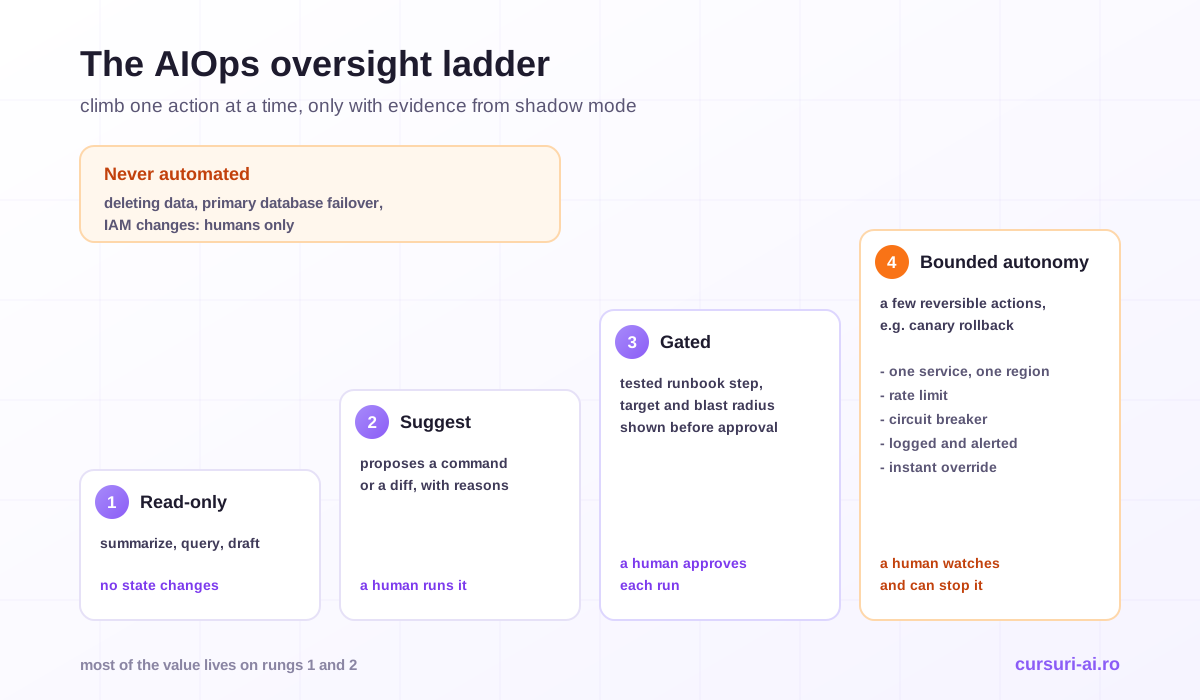
| Rung | What the AI may do | Example | Who acts |
|---|---|---|---|
| 1. Read-only assistance | Query, summarize, explain, draft | Summarize logs, draft a PromQL query, draft a status update | Nobody; no state changes |
| 2. Suggested actions | Propose a command or diff | "Roll back payments to v481", with the diff and the reason | A human runs it |
| 3. Gated automation | Trigger a tested, parameterized runbook step after approval | Restart one stateless deployment via an approve button in chat | A human approves each run |
| 4. Bounded autonomy | Run a few reversible actions unattended | Automatic rollback of a canary that breaches its SLO | Automation, with a human watching and able to stop it |
| Never automated | - | Deleting data, failing over a primary database, changing IAM | Humans only |
Most teams get most of the value on rungs 1 and 2. Rung 3 works well when runbooks are versioned, parameterized code rather than wiki pages, and the approval message shows exactly what will run, against which target, and the blast radius. ChatOps is a natural home for this: the request, the approver and the outcome are logged in the incident channel, which becomes your audit trail.
An action qualifies for rung 4 only if it is all of the following: narrowly scoped, reversible, proven over a long observation period, limited in blast radius (one service, one region, a few instances), rate-limited, behind a circuit breaker, logged and alerted, and instantly overridable. Rollback of a canary to the last known-good version is the classic candidate; "fix whatever is wrong" never is. A circuit breaker matters more than it sounds: if an automatic rollback fires three times in ten minutes because the pipeline keeps shipping the same broken build, the automation should stop and page a human rather than thrash production.
Earn each rung with data. Run the assistant in shadow mode first: it suggests, humans decide, and you record how often the suggestion matched what the engineer actually did. Promote a specific action to one-click approval only after it has been consistently right, and keep the record.
The risks of letting an agent act on production
Agentic tooling makes the investigation loop powerful: an agent with read access to metrics, logs, traces and the change log can pull everything an engineer would pull, in seconds, and hand over an evidence-backed diagnosis. The same loop with write access is a different system with a different risk profile. The production patterns for such agents (tool design, state, evaluation) are covered in How to Build AI Agents for Production; here are the risks specific to operations.
Excessive agency. OWASP lists it as a top risk for LLM applications (LLM03 in the 2026 edition, up from sixth place in 2025), describing it as "the vulnerability that enables damaging actions to be performed" in response to unexpected, ambiguous or manipulated model output, and naming three root causes: "excessive functionality", "excessive permissions" and "excessive autonomy". Its mitigation guidance maps directly onto operations: give the agent only the tools it needs, prefer narrow tools over shell access, grant read-only permissions where possible, require human approval for high-impact actions, and enforce authorization in the downstream system rather than "relying on an LLM to decide if an action is allowed or not".
Prompt injection through telemetry. Log lines, ticket text, commit messages and even HTTP headers can be written by an attacker. If that text reaches a model that holds write-capable tools, a planted instruction is one bad completion away from an action. Treat all telemetry as untrusted data, separate instructions from pasted evidence, and remember the strongest defense: an agent cannot be tricked into an action its tools do not expose. The wider threat model is in our guide to the OWASP Top 10 for LLM applications.
The tool list is the safety boundary. When someone asks whether an operations agent is safe, read its tool list and its credentials, not its reasoning trace. Some integrations make this explicit. For example, Grafana's official MCP server has a --disable-write flag that runs it in read-only mode. Use separate, least-privilege service accounts for the agent, log every tool call, and keep write-capable tools behind the same approval flow your humans use.
Machine-speed mistakes. A human who misdiagnoses usually notices before the third wrong command. An agent acting on a wrong premise can act again on the state its own first action created. Blast-radius limits and circuit breakers exist precisely for this.
Nondeterminism in control paths. The same prompt can produce different outputs. That is fine for a draft and unacceptable for a decision that must be reproducible, such as whether to scale a cluster. Keep LLMs out of control loops; let them propose, and let deterministic, tested code execute.
If your organization runs a security operations center, the same principles apply to automated response playbooks there; AI for Cybersecurity: Threat Detection and SOC Operations covers that side, from triage to response automation.
Measuring MTTR honestly
Every AIOps business case promises a lower MTTR. Be careful with that number.
First, decide what the "R" means: repair, recovery, resolution or restore. They are different clocks. DORA, whose metrics many teams report, renamed the metric "historically known as 'mean time to recover (MTTR)' or 'time to restore service'" in 2023: it is now failed deployment recovery time and covers only failures caused by a change, not every incident.
Second, the mean of incident durations is a fragile statistic. In Incident Metrics in SRE, Google's Štěpán Davidovič used Monte Carlo simulation and statistical analysis to show that mean-time metrics such as MTTR "are poorly suited for decision making or trend analysis in the context of production incidents." Incident durations vary enormously, a few long incidents dominate the average, and many teams have too few incidents per quarter to tell a real improvement from noise.
What to measure instead, or alongside:
| Question | Better measure |
|---|---|
| Are we paged less for noise? | Pages per on-call shift, share of actionable pages, alerts per incident |
| Do we notice sooner? | Time from SLO burn start to page, per incident class |
| Do we understand faster? | Time from page to a confirmed hypothesis, recorded in the incident timeline |
| Is the assistant right? | Hypothesis hit rate: how often its top hypothesis matched the postmortem's conclusion |
| Is reliability better for users? | SLO attainment and error budget spent per quarter |
| Did automation cause harm? | Incidents in which an automated or AI-suggested action made things worse |
Report medians and percentiles by incident class rather than one mean, set a baseline before rollout, and compare like with like. Write down the counterfactual too. If an AI correlation engine merges forty alerts into one incident, that is a toil win, but it does not shorten the outage. If an auto-rollback ends a bad deploy in three minutes, count it, and also count the time it rolled back a healthy one.
EU obligations that shape incident response
Two EU rules matter for anyone wiring AI into incident response in or for the European Union.
Personal data in telemetry. Beyond redaction and processor contracts, the GDPR's breach rule (Article 33) requires the controller to notify the supervisory authority "without undue delay and, where feasible, not later than 72 hours after having become aware of it", unless the breach is unlikely to result in a risk to people. A leaked production log full of customer identifiers is exactly that kind of breach, which is one more reason to redact before telemetry reaches any external tool.
NIS2 incident reporting. Entities in scope of the NIS2 Directive must report significant incidents to their CSIRT or competent authority on a fixed clock. Article 23 of Directive (EU) 2022/2555 sets an early warning "within 24 hours of becoming aware of the significant incident", an incident notification within 72 hours, and a final report "not later than one month after" the notification. The Directive applies through each member state's national law, so check your local transposition. An AI assistant that keeps an accurate, timestamped incident timeline and drafts the early warning from it is genuinely useful here. The submission, and the judgment about whether an incident is "significant", stay with accountable people.
This section is general information, not legal advice. Whether NIS2 applies to your organization and how your member state has transposed it are questions for your legal and compliance team.
A 90-day plan for adopting AIOps
- Days 1-30: telemetry and alerts. Adopt consistent OpenTelemetry resource attributes such as
service.nameand the deployment environment, send change events to your observability backend, define two or three user-facing SLOs with burn-rate alerts, and set up redaction in the Collector. Start the alert-quality scorecard so you have a baseline. - Days 31-60: read-only assistance. Give an assistant read-only access to metrics, logs, traces and the change log. Use it in real incidents for summaries, hypotheses and timeline drafting. Record its top hypothesis in every incident and compare it with the postmortem.
- Days 61-90: the first gate. Turn one well-understood runbook into versioned, parameterized code behind a chat approval step. Pick a reversible action in one service. Review every run.
If you later train your own anomaly or forecasting models rather than relying on your observability vendor's, they become production ML systems with their own versioning, monitoring and drift problems; that lifecycle is the subject of MLOps: The Machine Learning Lifecycle in Production.
The hard part is not any single tool. It is building the telemetry, the evidence discipline and the approval paths so that AI makes the on-call engineer faster without ever making production less safe, and that progression is what AI for DevOps and SRE: AIOps in Practice works through module by module, from OpenTelemetry to runbook automation.
Sources
- Google SRE Workbook, Alerting on SLOs
- Štěpán Davidovič, Incident Metrics in SRE, Google
- OpenTelemetry, Handling sensitive data
- OWASP GenAI Security Project, LLM06:2025 Excessive Agency (LLM03 in the 2026 edition)
- Directive (EU) 2022/2555 (NIS2), Article 23, EUR-Lex
Frequently Asked Questions (FAQ)
What is AIOps in DevOps and SRE? AIOps is the use of statistical methods, machine learning and large language models to help operations teams observe systems, detect problems earlier, diagnose them faster and respond more safely. In practice that means fewer and better alerts, summarized logs and traces, evidence-backed root-cause hypotheses, and runbook automation behind human approval.
Can AI replace on-call engineers? No. AI shortens the work on-call engineers do: it correlates alerts, summarizes telemetry and drafts hypotheses and updates. Decisions that change production, the incident commander role and accountability for the outcome stay with people. Teams that hand broad authority to an agent trade toil for a new class of self-inflicted incidents.
Is it safe to send production logs to an LLM? Only after redaction and only to a tool your organization has approved for that data. Logs often contain secrets and personal data such as email addresses, user IDs and IP addresses. Strip or hash those fields in the OpenTelemetry Collector or your log pipeline, make sure a processor contract covers any hosted model, and consider a self-hosted model for the most sensitive environments.
Which incident response actions can be automated with AI? Read-only work (querying, summarizing, drafting) can run freely. Actions that change production should go through a human approval step. Only a small number of narrow, reversible, well-tested actions, such as rolling back a canary to the last known-good version, should ever run without per-run approval, and then only with blast-radius limits, a circuit breaker and alerting.
How do you measure whether AIOps reduced MTTR? Do not rely on a single mean. Define which clock you are measuring, set a baseline before rollout, and report medians and percentiles by incident class. Track alongside it the share of actionable pages, time to a confirmed hypothesis, how often the assistant's top hypothesis matched the postmortem, and SLO attainment.
Conclusion
AIOps pays off for DevOps and SRE teams when it is applied in the right order and with the right limits. Fix alerting first with SLO burn rates, grouping and change events, then let models correlate and enrich what remains. Use LLMs to compress logs and traces into cited summaries and to propose hypotheses with the evidence for and against, and keep the decision with the incident commander. Automate runbooks one rung at a time, with approval gates, least-privilege tools, blast-radius limits and circuit breakers, because an agent's tool list is its real safety boundary. Measure the result with numbers that can survive scrutiny rather than one flattering MTTR, and keep telemetry clean of personal data before it reaches any model.

The course that continues this article
AI for DevOps and SRE: AIOps in Practice
You have read the theory. In the course you put it into practice: written lessons structured in modules, with examples and exercises, quizzes, the AI Professor in every lesson and progress saved automatically. Once you complete the lessons and reach the minimum quiz score, you get the Certificate of Completion, a private attestation.
From the course syllabus
- AIOps in 2026: Foundations and the Modern Stack
- Intelligent Observability: OpenTelemetry, Prometheus, Grafana
- Anomaly Detection and Intelligent Alerting
- AI-Assisted Log and Trace Analysis
+ 6 more modules in the full syllabus
€99 per month for this course, VAT included · or pick it in a subscription of 3, 5 or 10 courses, from €199 per month, together with other IT courses; you can change them at every renewal (see what you learn across the whole track).
Monthly subscription with automatic renewal · stop the renewal anytime from your account · digital content with immediate access, see the withdrawal conditions. The certificate confirms that you completed the course and is private: it is not a diploma or a state-recognised qualification.