Most writing about AI in supply chain is a list of twenty use cases with a vendor logo next to each. Operations managers need a shorter list and a harder question: which decisions get measurably better, compared with what, and how will you know within one quarter? This guide covers the use cases with a real baseline, how to evaluate a demand forecast properly, the data you need first, where AI fails in planning, a 90-day pilot with a scorecard you can copy, and the EU rules that apply once people's data is involved.
Where AI in supply chain actually pays off
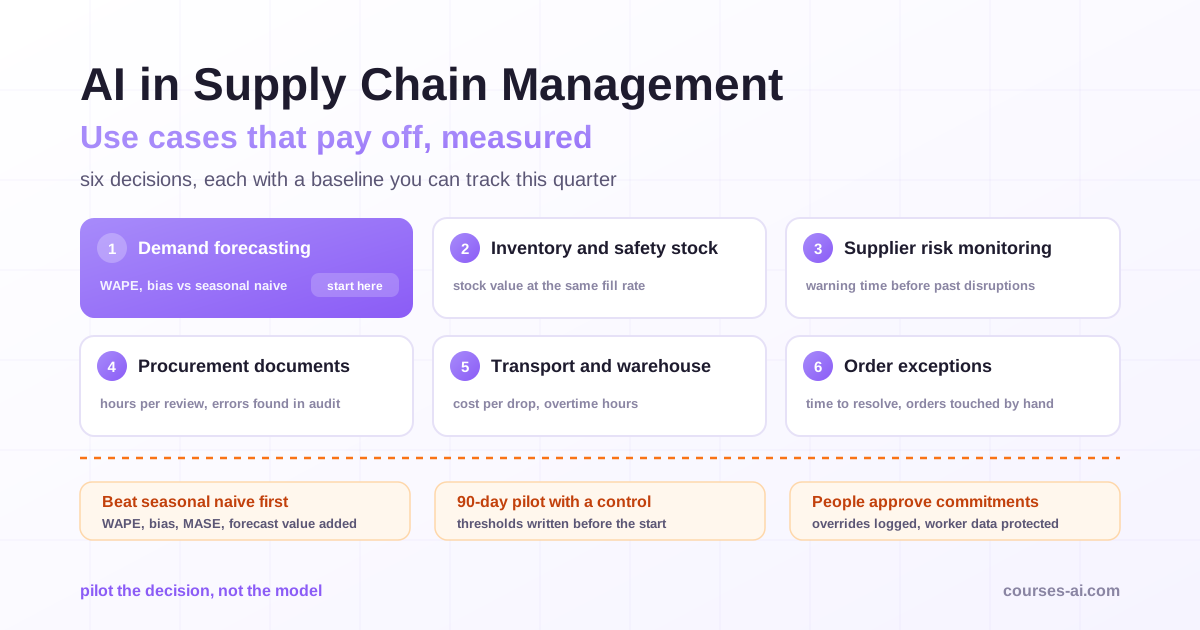
A use case is worth piloting when three things are true: the decision repeats often, you already measure its outcome, and a wrong answer is cheap to detect and reverse. That filter removes most of the slideware and leaves six areas where mid-sized companies can prove value with data they already have.
| Use case | Decision it improves | Baseline you can measure today | Data it needs first |
|---|---|---|---|
| Demand forecasting | How much we sell, per item, location and period | Current error and bias versus a seasonal naive forecast | Two to three years of order history, promotion and price calendar |
| Inventory and safety stock | Buffer needed for a target service level | Stock value, fill rate, stockout days, excess stock | Forecast error, lead times and their variability, service targets |
| Supplier risk monitoring | Which supplier needs attention before it fails | On-time-in-full, quality incidents, warning time before past disruptions | Supplier master data, delivery history, permitted external signals |
| Procurement document work | Comparing quotes, contracts and specifications | Hours per review, errors found in audit | The documents, a clause checklist, approved tools |
| Transport and warehouse planning | Routes, loads, pick waves, labor plans | Cost per drop or order line, overtime hours | Clean addresses, time windows, hard constraints |
| Customer order exceptions | Which late or blocked orders need a human first | Time to resolve, share of orders touched manually | Order status events, customer priorities, reason codes |
What is missing matters: "autonomous supply chain" and anything that removes the planner has no baseline you can measure in a quarter. The six above monetize through a few mechanisms (inventory released, write-offs and expedites avoided, hours redeployed, service protected), and finance can price each one.
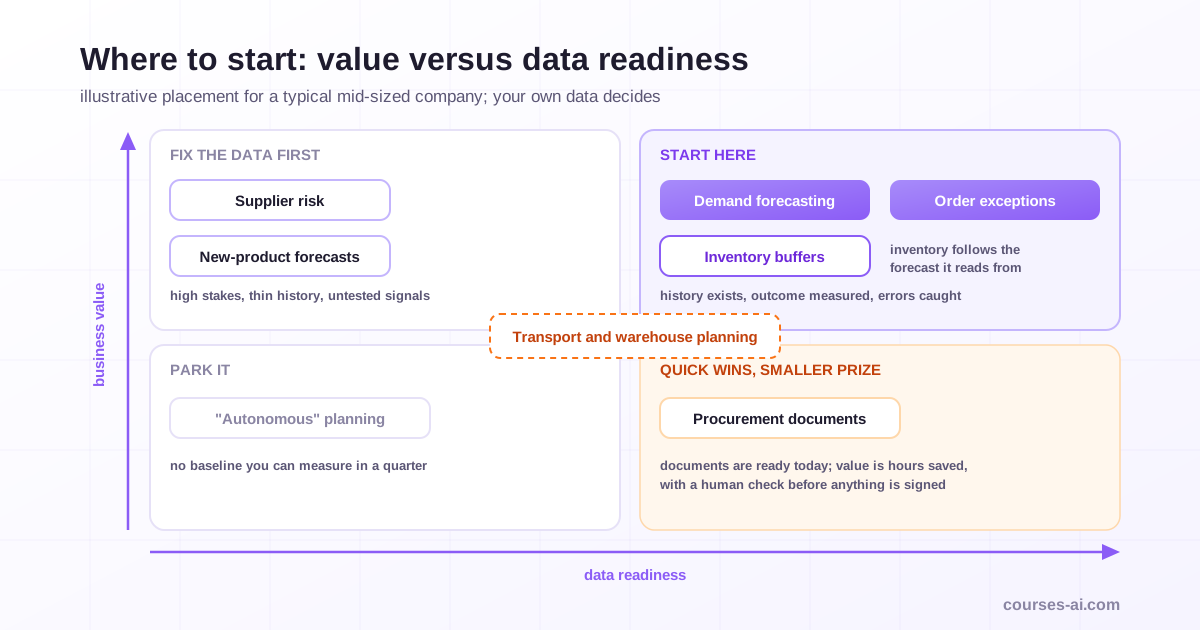
Forecasting usually comes first: every downstream decision reads from it, and its quality is the easiest thing in the chain to measure honestly. Mapping each use case to its money path and its oversight level is the backbone of AI for Operations and Supply Chain, which treats forecasting as the first link rather than a standalone project.
Start with the decision, not the model
Before evaluating a tool, write one sentence the pilot can prove wrong: "If we add machine-learning forecasts with exception review for A-items in one region, error and bias fall against a control region, which lets us lower safety stock at the same fill rate." It names a metric, a mechanism, a scope and a comparison. If the team cannot write it, it is shopping for technology.
Then answer three questions:
- Who owns the decision today? The output must land in that planner's, buyer's or dispatcher's workflow, or it will be ignored.
- What happens when the AI is wrong? If a wrong suggestion is caught at approval, the AI recommends and a human approves. If it would ship, injure someone or bind the company to a contract, the human decides and AI only supplies evidence.
- What does doing nothing cost? Expedites, write-offs and overtime are already in the ledger and size the prize better than any vendor benchmark.
AI demand forecasting: measure it before you trust it
Forecasting has the strongest public evidence and the most misleading sales claims, because it is easy to measure badly.
The baseline every forecast must beat
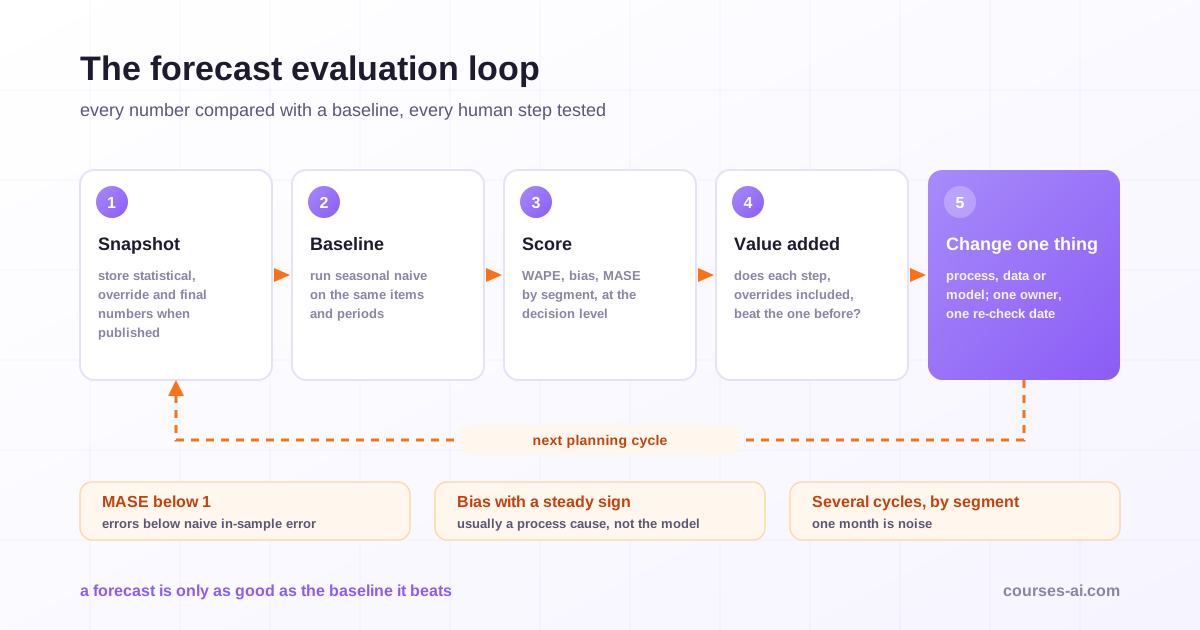
An accuracy number alone means nothing: twenty percent error is excellent on volatile fashion items and poor on stable consumables. Compare every method against a naive benchmark on the same items and periods. For seasonal demand, the standard one is seasonal naive: next March's forecast is last March's actual. It has no parameters, costs nothing to run, and a model that cannot beat it adds nothing.
One of the largest public tests on retail demand is the M5 competition: 42,840 hierarchical unit-sales series from Walmart. The organisers concluded that machine learning methods, particularly gradient-boosted trees (LightGBM), were superior: every one of the top 50 submissions beat the most accurate statistical benchmark. Yet only a small minority of the thousands of participating teams beat that benchmark, and the winners' advantage shrank sharply at product-by-store level, where demand is sparse and noisy. The organisers also stressed explanatory variables (prices, promotions, calendar events) and combining models. The reading for planners: machine learning can win across many related items with good drivers, but only when tested against a baseline on your own data, at the level where you decide.
Building and backtesting those models, from seasonal baselines to gradient-boosted trees, is the subject of Time Series Forecasting with Machine Learning, written for the analysts who support planning teams.
MAPE, WAPE, bias and MASE in plain terms
"How accurate is our forecast?" is two questions: how far off are we (accuracy), and are we consistently high or low (bias)? Noise drives safety stock; bias fills warehouses with excess or starves them into stockouts.
- MAPE (mean absolute percentage error) averages each item's percentage error. Intuitive, but undefined when actual demand is zero and inflated on small items, so a few slow movers can dominate the headline.
- WAPE (weighted absolute percentage error, also written WMAPE) divides total absolute error by total actual demand. Big items count more, which is usually what the business cares about.
- Bias is the signed error: total forecast minus total actual, as a share of actual. A persistent sign is a process signal, often an optimistic promotion plan or a target dressed up as a forecast.
- MASE (mean absolute scaled error) divides your error by the in-sample error of a naive or seasonal naive forecast; Hyndman and Koehler proposed it as a standard for comparing accuracy across many series. Below 1, your errors are smaller than the naive method's typical in-sample error; above 1, they are larger, a strong hint that the model adds nothing over the naive rule.
An illustrative month with three items shows why the choice matters. Item A: forecast 1,200, actual 1,000. Item B: forecast 400, actual 500. Item C: forecast 30, actual 10.
| Metric | Calculation | Result |
|---|---|---|
| MAPE | (20% + 20% + 200%) / 3 | 80% |
| WAPE | (200 + 100 + 20) / 1,510 | 21.2% |
| Bias | (+200 − 100 + 20) / 1,510 | +7.9% |
Shown 80%, leadership buys a new tool. Shown 21.2% with an upward bias, it asks why we run high, and whether item C needs a forecast or just a stock rule.
Forecast value added: are the overrides helping?
A typical process has several steps: statistical forecast, planner overrides, sales input, consensus. Forecast value added (FVA) measures each step against the naive benchmark and against the step before it. If overrides make stable items worse, you are paying for effort that destroys accuracy.
FVA needs one discipline many companies skip: store each step's number at the moment it was published. Judge it over several cycles and by segment, because overrides on promoted or launched items often add value while overrides on stable items subtract it, and a blended average hides exactly that.
AI inventory optimization: where forecast error becomes cash
Safety stock absorbs uncertainty in demand and supplier lead times, so it is driven mainly by forecast error, lead time and lead-time variability, not by the forecast level alone. A better forecast does not cut stock by itself; someone has to recalculate the buffers and approve the change.
Where AI helps:
- Segmenting the range. ABC (value) crossed with XYZ (variability) shows which items deserve modeling effort and which are mostly noise to cover with a simple policy.
- Recalculating buffers as error and lead times change, not once a year.
- Intermittent demand. Spare parts sell zero most weeks; a forecast of 0.3 units a week never happens. You need a demand distribution and a stock level that hits a service probability, judged with metrics built for zeros.
- Ranking excess stock by the action that recovers the most value.
Planners still set service targets, approve buffer changes that move a lot of cash, and protect strategic customers and launches the model cannot see.
Supplier risk, procurement documents and order exceptions
Much of procurement and customer service is reading documents, emails and status messages, then deciding which ones matter. Language models changed the economics of that reading.
Supplier risk monitoring. Models can turn delivery history, quality incidents and permitted external signals into a weekly watch list. The test is warning time: in a back-test on past disruptions, did the signal appear early enough to act? A score that lights up on the day of the late delivery is not an early warning.
Procurement documents. Comparing quotes against a specification, extracting payment or liability clauses, drafting a summary for the buyer: good drafting tasks, because a human checks the output against the source before anything is signed. Use approved tools only; supplier prices and contract terms are highly confidential.
Order exceptions and AI agents in the supply chain. The most practical use of agents today is triage, not autonomy. An agent reads order and delivery events, classifies the exception (short shipment, missing document, credit block, carrier delay), drafts the customer message and routes the case to the right person, ranked by impact. It should not change orders, issue credits or promise dates on its own. The engineering behind that boundary (narrow tool permissions, logs, evaluation on real cases) is covered in How to Build AI Agents That Work in Production.
AI in logistics and warehouse planning
Route optimization, load building, slotting and pick-wave planning are older than the current AI wave, and the tools are mature. AI adds better travel-time estimates, faster replanning when orders change, and plain-language explanations of a plan. Two rules keep these projects out of trouble:
- Hard constraints stay hard. Legal driving and rest-time limits, vehicle weights, dock capacity and safe working pace are constraints in the engine, not targets to shave. A plan that breaks them is illegal, not cheaper.
- Planning data is not performance data. Telematics and scan data that can be linked to a driver or picker are personal data, even when collected only to plan routes and shifts. Reusing them to score or discipline individual drivers or pickers is a new purpose: it must pass the GDPR compatibility test or have its own legal basis, and it can make the system high-risk under Annex III point 4(b) of the EU AI Act (see below).
Measure logistics pilots on cost per drop, on-time delivery and overtime hours, against matched days or a control depot.
The data you need before any model
Many pilots fail on data rather than algorithms. Before a vendor demo, check five things:
- History that reflects demand, not supply. Shipments during a stockout record what you could ship, not what customers wanted. Flag stockouts, or the model learns that demand drops whenever you run out.
- A promotion and price calendar. Without it, past promotions look like random noise.
- Clean master data. Item hierarchies, units of measure, lead times, supplier links. A wrong pack size breaks a forecast more reliably than a weak model.
- Stored snapshots of the forecast, the overrides and the final plan each cycle, so accuracy and FVA can be computed later.
- An owner per dataset who can answer "is this field right?" within a day.
Analysts can do much of this profiling with general AI assistants, provided they verify every number the assistant computes; the checking protocol in How to Analyze Data with AI Without Coding applies directly to a demand extract.
Where AI fails in supply chain planning
- Promotions and events. Uplift depends on mechanics, display, competitors and cannibalization, and a new mechanic has no history. Keep uplift as a reviewed input with written assumptions.
- New products. A model can borrow the demand-curve shape of similar past launches, but the level remains a judgment. The first weeks of real sales beat any pre-launch model, so plan a smaller first buy and agreed decision points.
- Structural breaks. A lost customer, a new channel or a supply shock makes the past a poor guide. Alert when actuals leave the forecast's uncertainty band and let a human decide whether the world changed.
- Censored and dirty data. Stockouts recorded as low demand, returns booked as negative sales, moving holidays. Each quietly biases the model.
- Black-box overrides. Planners who do not understand a forecast override it silently, and the company pays for a model nobody uses. The opposite failure is as common: a usually-right tool gets rubber-stamped until nobody reviews it. Log every override with a reason code, and treat an override rate that falls to zero as a warning.
A 90-day pilot plan for AI in supply chain
Ninety days covers several planning cycles. One scope (a region, category or site), one owner, numeric success and stop criteria agreed up front.
| Weeks | What happens | Output |
|---|---|---|
| 0 to 2 | Freeze the baseline: twelve months of WAPE, bias, stock and service for the pilot and a control scope, measured the same way. Run seasonal naive on the same items. | Baseline signed by planning and finance |
| 3 to 4 | Fix data for the scope only: stockout flags, promotion calendar, master data. Define the exception queue and override reason codes. | Data checklist, approval level per output |
| 5 to 12 | Run in the real workflow: planners use the output themselves, overrides are logged, forecasts snapshotted each cycle. Weekly 30-minute review. | Weekly scorecard, issue log |
| 13 | Scale, redesign or stop, against the week-0 criteria. Price the benefit from the pilot-versus-control difference, with full integration and running costs. | One-page decision memo |
Compare against a control or the same period last year, never the previous quarter, or seasonality takes the credit. And instrument adoption, not only accuracy: override rates and planner minutes per exception are early signals of whether the tool will survive at scale.
Copyable: one-screen pilot scorecard
| Line | Threshold agreed in week 0 | Baseline | Pilot | Control |
|---|---|---|---|---|
| WAPE, A and B items | Improves by X points more than control | |||
| Bias, A and B items | Within ±Y% for three cycles running | |||
| MASE versus seasonal naive | Below 1 on most A items | |||
| FVA of planner overrides, by segment | Positive, or the override policy changes | |||
| Fill rate or OTIF | No lower than baseline | |||
| Stock value or days of cover | Lower by Z, at held service | |||
| Override rate and top reason codes | Stable, explained, never silently zero | |||
| Planner minutes per exception | Falls after week 8 | |||
| Open data issues | None older than two weeks | |||
| Action taken from last review | One action, one owner, every cycle |
Fill X, Y and Z before the pilot starts. If the last line stays empty for a month, you have a dashboard, not a learning loop.
EU duties: GDPR and the AI Act
Much supply chain AI processes no personal data: item histories, prices, lead times. The duties change when the system touches people.
GDPR. Driver locations, scan rates and employee identifiers are personal data. Purpose limitation and data minimisation decide which designs are lawful: route-planning data is not automatically available for performance scoring. Article 22 gives people the right not to be subject to a decision based solely on automated processing that produces legal effects or similarly significantly affects them, so a model score should never be the only basis for disciplining a worker. Where processing is likely to result in a high risk to people's rights, Article 35 requires a data protection impact assessment first.
EU AI Act: what is high-risk. Routine demand forecasting, inventory optimization and quote comparison are not among the uses listed in Annex III. Annex III point 4(b) does list AI systems intended to be used "to allocate tasks based on individual behaviour or personal traits or characteristics or to monitor and evaluate the performance and behaviour of persons" in work relationships. Labor modules that score pickers, driver-scoring tools and dispatch based on individual behaviour can fall there. According to the European Commission, high-risk rules for Annex III systems apply from 2 December 2027, after the AI Omnibus moved the date. Separately, since 2 February 2025 Article 5(1)(f) prohibits AI systems that infer the emotions of people in the workplace, except for medical or safety reasons. Detecting a physical state such as driver fatigue is not emotion recognition (recital 18), but "mood" or "stress" features that read faces or voices need checking against the prohibitions, not only the high-risk list.
AI literacy (Article 4). This applies to every deployer now. Since the amendment in force from 27 July 2026, Article 4 requires providers and deployers to "take measures to support the development of AI literacy" of their staff, without guaranteeing a specific level for each person. The Commission's Q&A adds that no certificate is required and that an internal record of training can document it. In practice: role-based training, deeper for the planner approving AI-recommended buffers than for a colleague using a writing assistant. The full timeline and a deployer checklist are in the EU AI Act compliance guide for businesses.
Frequently Asked Questions (FAQ)
What is the best first use case for AI in supply chain? For most mid-sized companies, demand forecasting for the items that carry most of the volume: every other decision reads from it, and its quality can be measured against a seasonal naive baseline within a few planning cycles. Order exception triage is a good alternative when planning data is weak but order status events are clean.
How do you measure whether an AI demand forecast is better? Compare it with a seasonal naive forecast and with your current process on the same items and periods, at the level where decisions are made. Track WAPE, bias and MASE, and use forecast value added to check whether each human step helps. Judge over several cycles, not one month.
Can AI agents run supply chain decisions on their own? Not responsibly for decisions that commit money, change customer promises or affect people. Agents work well for reading, classifying and routing exceptions and for drafting messages a person approves. Keep commitments, credits and supplier changes with an accountable human, and log what the agent did.
Is supply chain AI high-risk under the EU AI Act? Routine forecasting, inventory and procurement support are not listed in Annex III. Systems that allocate tasks based on individual behaviour or monitor and evaluate worker performance can be, under Annex III point 4(b), with high-risk rules applying from 2 December 2027. AI literacy measures under Article 4 already apply to every deployer.
Conclusion
AI in supply chain pays off where a decision repeats, its outcome is already measured, and a wrong answer is caught before it ships. Forecasting, inventory buffers, supplier watch lists, procurement documents, transport and warehouse planning, and order exception triage pass that test. Evaluate forecasts against seasonal naive with WAPE, bias, MASE and forecast value added, fix the data that misrepresents demand, and run a 90-day pilot with a control and thresholds agreed in advance. Keep people in charge of commitments and of anything that judges a worker, and treat GDPR and the AI Act as design inputs, not a final review.
Sources
- M5 accuracy competition: Results, findings, and conclusions, Makridakis, Spiliotis and Assimakopoulos, International Journal of Forecasting 38(4), 2022
- Another look at measures of forecast accuracy, Hyndman and Koehler, International Journal of Forecasting 22(4), 2006
- AI Act: regulatory framework and timeline, European Commission
- AI literacy: questions and answers, European Commission, updated 20 October 2026
Verified on 10 November 2026 against the M5 competition paper, Hyndman and Koehler (2006), the European Commission AI Act and AI literacy pages, Annex III of Regulation (EU) 2024/1689 and Articles 22 and 35 GDPR. General information, not legal advice.

The course that continues this article
AI for Operations and Supply Chain
You have read the theory. In the course you put it into practice: written lessons structured in modules, with examples and exercises, quizzes, the AI Professor in every lesson and progress saved automatically. Once you complete the lessons and reach the minimum quiz score, you get the Certificate of Completion, a private attestation.
From the course syllabus
- Module 0 — AI in Operations and Supply Chain in 2026
- Module 1 — Demand Forecasting and Planning
- Module 2 — Inventory Optimization
- Module 3 — Procurement and Supplier Management
+ 6 more modules in the full syllabus
€99 per month for this course, VAT included · or pick it in a subscription of 3, 5 or 10 courses, from €199 per month, together with other Business courses; you can change them at every renewal (see what you learn across the whole track).
Monthly subscription with automatic renewal · stop the renewal anytime from your account · digital content with immediate access, see the withdrawal conditions. The certificate confirms that you completed the course and is private: it is not a diploma or a state-recognised qualification.