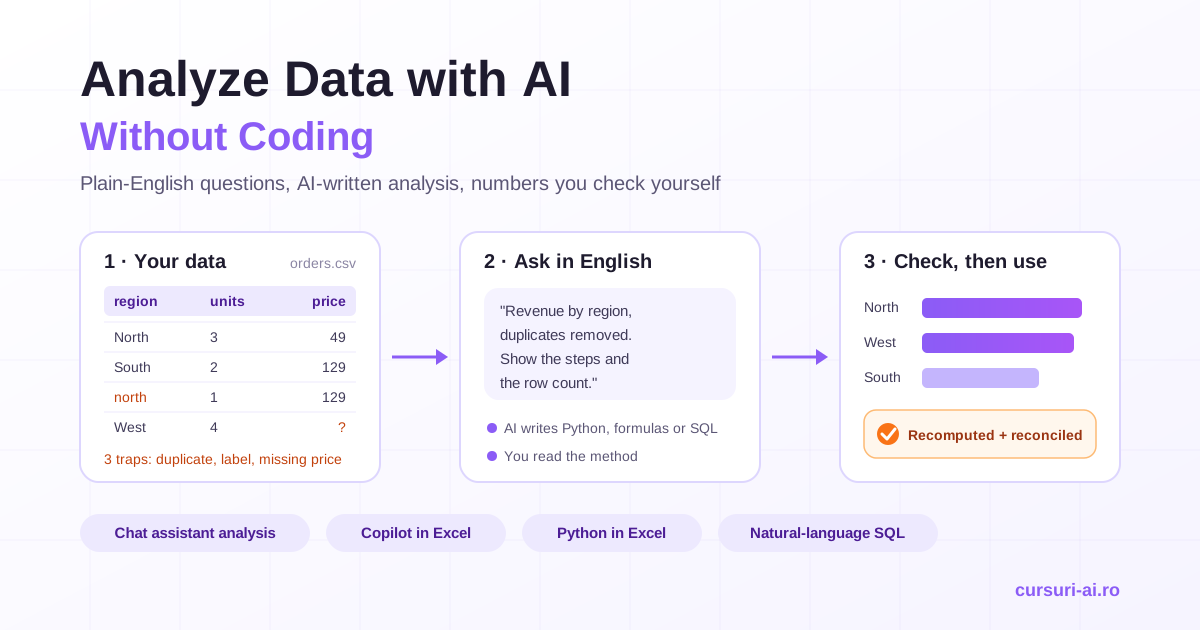
You can now analyze data with AI without coding: upload a spreadsheet, ask a question in plain English, and get back a cleaned table, a chart and a short explanation in under a minute. The catch is that the answer always looks confident, whether it is right or not. This guide shows which tool fits which kind of data, the exact prompts that produce reliable analysis, and the checks that stop a wrong number from reaching a slide deck.
What "no-code" data analysis with AI actually means
When an analyst or a marketing manager "analyzes data with AI", the AI is usually still writing code; you just do not see it unless you ask. OpenAI describes the ChatGPT workflow in one line: "ChatGPT writes and runs the Python code for you" (OpenAI Academy). Copilot in Excel does the same inside your workbook with formulas, tables, PivotTables and, since August 2026, Python.
You no longer need the syntax of a pivot or a regression. You do need three skills the tool cannot supply:
- Asking an analyzable question. "How is the business doing?" is not one. "Which region had the highest revenue in July and August 2026, after removing duplicate orders?" is.
- Knowing your data. What one row represents, what each column means, which values are suspicious.
- Checking the result. Every vendor's documentation says some version of "verify before you rely on it". That sentence is your job, not a disclaimer.
These three skills, applied across ChatGPT, Excel and SQL, are the backbone of No-Code Data Analysis with AI. Here is the working version: the tool landscape on 31 October 2026, a worked example you can reproduce in ten minutes, and a protocol for checking any AI-generated number.
The four no-code routes, and when to use each
There is no single best tool. The right one depends on where your data already lives and what your organization allows.
| Route | Your data lives in | Best for | Watch out for |
|---|---|---|---|
| Chat assistant with data analysis (e.g. ChatGPT) | A CSV or Excel export | Exploration, cleaning, quick charts, one-off questions | Uploading data your company has not approved for that tool |
| Copilot in Excel | A workbook you already maintain | Changes inside the workbook: formulas, tables, PivotTables, charts | Licensing; edits land directly in your file |
| Python in Excel (driven by Copilot) | A workbook | Statistics, forecasting, simulations, advanced charts | Availability depends on plan, channel and platform |
| Natural-language SQL | A database or data warehouse | Questions over data too large or too live to export | Plausible queries that join or filter the wrong way |
1. A chat assistant with data analysis
This is the lowest barrier. According to the same OpenAI guide, you can "import data by uploading a data file (ex. CSV or XLSX), or connect directly to Google Drive or OneDrive", start with "Describe this data", and continue with plain-language requests like "Show monthly revenue in a bar chart." It can "suggest useful questions, analyze your data, and generate interactive charts", and you download the results at the end.
Two notes from that page are worth taking literally: "the best results are typically seen when using reasoning models", and "define metrics clearly from the start and confirm them with ChatGPT." Use this route for exploration: understanding a new export, cleaning it, testing a hypothesis. It is not a production reporting pipeline; OpenAI points fully automated workflows to its API.
2. Copilot in Excel
If your numbers already live in a workbook, Copilot works on the file itself. "Copilot in Excel offers three modes: edit, plan, or chat." In edit mode it "edits your workbook directly based on your requests"; plan mode lets you "come up with a plan before editing your workbook"; chat mode keeps "Copilot responses contained within your chat" (Microsoft Support). Capabilities include "editing worksheets, generating and transforming data, highlighting, sorting, and filtering your data" and fetching information from the web. A practical rule: start in plan or chat mode on a copy, read what Copilot intends to do, then let edit mode touch the real workbook.
Copilot in Excel is not part of every Microsoft 365 subscription. Microsoft lists four kinds of eligible subscriptions, from a Personal or Family plan with an AI credits plan to a Copilot Chat-eligible business or enterprise subscription, and your organization's settings also matter. If the Copilot button is missing, ask IT about your license before assuming the feature does not exist.
One function you should no longer learn. The =COPILOT() worksheet function, which called the AI from inside a cell, was a preview available only in the Frontier and Microsoft 365 Insider programs, and it still appears in many tutorials. Microsoft has retired it: "Starting September 14, 2026, the COPILOT function is no longer available in Microsoft Excel." Instead, "you can continue to use Copilot in Excel through the Copilot pane, which supports many of the same AI-powered tasks" (Microsoft Support). If a team template still contains =COPILOT( formulas, rebuild those steps through the pane. Copilot across Word, Outlook, PowerPoint and Teams is covered in Microsoft 365 Copilot for Office Work.
3. Python in Excel, without writing Python
Python in Excel runs Python calculations in the cloud from cells in the grid, with libraries from the Anaconda distribution; you start it by typing =PY in a cell or from Formulas > Insert Python. The change that matters for non-programmers came in Microsoft's release notes of 25 August 2026, "Use Python when Editing with Copilot in Excel" (Windows, Mac, web): "Edit with Copilot helps you work with Python in Excel by executing Python code for advanced analysis, automation, and data transformation with results outputted directly in your workbook", including "statistics, simulations, advanced visualizations" (Microsoft 365 Copilot release notes). You describe the analysis; Copilot writes and runs the Python.
Check availability before you promise anything. Python in Excel is available to Enterprise and Business users on Windows (from specific update channels), on the web and on Mac; "all Excel for Windows customers with Enterprise or Business Microsoft 365 subscriptions running the Current Channel can use Python in Excel at standard compute speeds without a paid license", while faster premium compute needs an add-on license. For Family and Personal users it is in preview, and perpetual consumer licenses do not support it (Microsoft Support). It needs an internet connection and is not available on iPad, iPhone or Android.
4. Natural-language SQL
When data sits in a database, an export is stale the moment you make it. Here the AI turns your question into a SQL query. Some platforms build this in: Google's BigQuery documentation lists "generating code from natural language prompts" among its Gemini features. Any chat assistant can do it too if you paste the table and column definitions.
You do not need to write SQL, but you must read it well enough to answer three questions: which tables does it use, how does it join them, and what does the WHERE clause filter out? The same BigQuery page warns that the assistant "can generate output that seems plausible but is factually incorrect." A query that joins orders to customers on the wrong key still returns a tidy table.
Before you upload anything: data and privacy
Most bad AI analysis starts before the first prompt.
Shape the data.
- One header row, one record per row, no merged cells, no subtotals inside the data.
- Clear column names (
order_date, notCol F), with units where they matter (unit_price_eur). - In Excel, format the range as a table so there is no doubt where the data ends.
- Write a short data dictionary (what one row means, what each column means, known gaps) and paste it into your first prompt.
Protect the data.
- Use the AI tool your organization has approved, signed in with your work account, and ask IT or your privacy team which data-handling terms apply to it.
- Do not upload personal data (names, emails, health or salary details) unless that use is explicitly approved. Most questions do not need it: replace names with IDs and drop open-text fields you will not analyze.
- To design an analysis before you have approval, work on a synthetic sample with the same columns, as below.
Worked example: twelve orders, one question, one verified answer
Here is a small synthetic dataset, imperfect the way real exports are. Save it as orders.csv to follow along in ChatGPT, or paste it into Excel for Copilot.
order_id,order_date,region,channel,product,units,unit_price
1001,2026-07-03,North,Online,Starter,3,49
1002,2026-07-05,South,Partner,Pro,2,129
1003,2026-07-09,north,Online,Pro,1,129
1004,2026-07-14,West,Direct,Team,1,399
1005,2026-07-21,South,Online,Starter,5,49
1006,2026-07-28,West,Partner,Pro,4,
1007,2026-08-02,North,Direct,Team,2,399
1008,2026-08-06,South,Online,Starter,2,49
1008,2026-08-06,South,Online,Starter,2,49
1009,2026-08-11,West,Online,Pro,3,129
1010,2026-08-19,North,Partner,Starter,6,49
1011,2026-08-27,South,Direct,Team,1,399
The business question: which region generated the most revenue in July and August 2026? It sounds trivial. The file contains three traps that change the answer.
Prompt 1: understand before you compute
I uploaded orders.csv. One row = one order line. Revenue = units x unit_price (EUR).
Before any calculation:
1. Tell me how many rows and columns you see, and list the column names exactly.
2. Report data quality issues: duplicates, missing values, inconsistent labels.
3. Do not change or fill anything yet. Just list what you found.
A good answer reports 12 rows and 7 columns, and three issues: order 1008 appears twice, north is spelled in lowercase in order 1003, and order 1006 has no unit_price. If the tool reports a column that is not in the file, or a different row count, stop: everything after would rest on a misread file.
Prompt 2: clean with explicit, logged decisions
Apply these rules and show me a table of every change you made:
- Remove exact duplicate rows (keep the first occurrence).
- Standardize region names to title case.
- Order 1006 is missing unit_price. Every other Pro row is priced at 129.
  Fill it with 129 and add a column "price_assumed" = yes for that row.
Then tell me the row count after cleaning.
The rule for missing values is a business decision, not a technical one. Here we assume the list price; with your data, the right call might be to ask sales operations or exclude the order. What matters is that the assumption is written down and flagged. After cleaning you should have 11 orders.
Prompt 3: the actual question
Using the cleaned data, calculate total revenue by region for July-August 2026.
Show: region, number of orders, total revenue, share of total.
Sort by revenue, highest first. Show the total row and the calculation steps.
The correct result:
| Region | Orders | Revenue (EUR) | Share |
|---|---|---|---|
| North | 4 | 1,368 | 37.3% |
| West | 3 | 1,302 | 35.5% |
| South | 4 | 1,000 | 27.2% |
| Total | 11 | 3,670 | 100% |
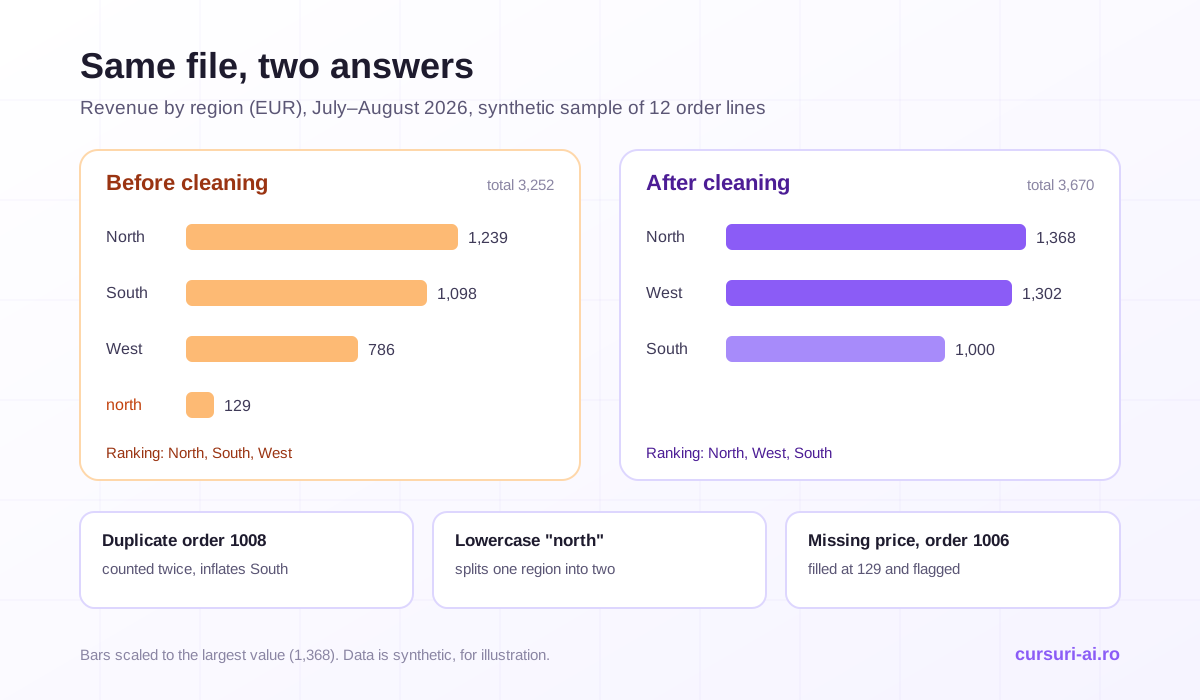
Now look at what the uncleaned file would have produced: North 1,239, South 1,098, West 786, plus a separate "north" line of 129, for a total of 3,252. The duplicate inflates South, the missing price deflates West, and the lowercase label splits North. West and South swap places. Nothing about the naive table looks wrong. That is the whole point.
Prompt 4: a chart and a second cut
Create a bar chart of revenue by region (cleaned data), with the value on each bar.
Then break revenue down by month (July vs August) and by channel.
Expected: July 1,694 and August 1,976; Direct 1,596, Partner 1,068, Online 1,006. Each breakdown must add up to the same 3,670. If one of them does not, a filter or a dropped row slipped in somewhere.
Prompt 5: make it challenge itself
Re-check your regional totals with a different method (for example, sum revenue
per order first, then group). Do both methods match? Which rows, if any, depend
on an assumption? How would the ranking change if order 1006 were excluded?
Excluding order 1006 moves West down to 786 and the ranking to North, South, West. That sentence belongs in your report: "West ranks second only if the missing price on order 1006 is 129; please confirm." A conclusion that depends on a single assumed value is fragile, and your reader deserves to know.
How to check the AI's numbers: a 5-step protocol
Microsoft's Copilot in Excel FAQ is plain: "Review, edit, and verify anything Copilot creates before you rely on it." It adds that explanations come "in fluent, grammatically correct language, but the content can be inaccurate or inappropriate." Fluent is not correct. This protocol turns "it looked right" into a procedure anyone can repeat.
1. Ask for transparency. Before accepting a number, ask how it was produced: "Show me the formula, the code or the SQL you ran, which columns you used and over how many rows." Check that column names match your headers exactly and that no filter was added. OpenAI's tip agrees: "Review generated code or output tables carefully."
2. Sanity-check the order of magnitude. Estimate before you read. In the example, the most expensive product costs 399 and the largest order has six units of a 49 product, so 11 orders cannot plausibly total 30,000 or 300. Look for impossible values too: shares above 100%, negative quantities, dates outside the period.
3. Recompute a sample yourself. Pick one group and calculate it yourself. In Excel, add revenue = units * unit_price in a helper column and use =SUMIFS(H:H, C:C, "West") for one region. Use =COUNTIF(A:A, A2)>1 to flag duplicate order IDs. A mismatch found here is a problem found early.
4. Ask the counter-question. Ask questions whose answers you know or that must reconcile: "How many orders are in the cleaned file?", "Do the monthly totals add up to the regional total?", "Which rows did you exclude, and why?"
5. Reconcile with a trusted source. Compare the total with a number you already trust: the finance system, last month's official report, the dashboard. Explained differences (refunds, cut-off dates) are normal; unexplained ones are a stop sign.
Scale the effort to the stakes: a brainstorming chart needs steps 1 and 2; a number in a board deck or a pricing decision needs all five and a second reviewer. For legal, financial or medical decisions, Microsoft's advice is to "avoid using Copilot for decisions in sensitive areas such as finance, legal, or medical topics"; treat AI analysis there as a draft for an expert, not as the decision.
Prompt patterns that make AI data analysis reliable
Good data prompts are boring and specific, in ChatGPT, Copilot or a SQL assistant alike:
- Define the metric and the grain. "Revenue = units x unit_price, excluding refunds; one row = one order line" prevents both vague answers and double counting.
- Separate cleaning from analysis. Two prompts with a change log in between are easier to check than one that does everything.
- Ask for counts and assumptions. "Show the rows behind each figure and list every assumption you made" exposes silent filters and hidden choices.
- Mind the language. Microsoft notes that Copilot "was trained on sources predominantly in English and may not perform as well when prompts or data are in other languages." If your headers are not in English, translate them in the data dictionary.
The general craft is covered in Prompt Engineering in 2026: From Beginner to Pro; the data-specific rule is that every prompt should leave a trail you can audit.
When not to use AI on your data
AI analysis is a strong assistant and a poor authority. Skip it, or keep it strictly as a draft, when:
- The data is not approved for the tool. No insight is worth a data protection incident.
- The question is causal and the sample is small. The tool will happily explain why North beat South from eleven orders. Eleven orders support a description, not a cause.
- The number feeds an automated or regulated process. A conversation is not a reproducible pipeline; build that with your data team.
- You cannot check the result. An unverifiable figure does not belong in a decision.
For managers deciding where AI analysis fits in a team's workflow, the AI playbook for business leaders covers governance and rollout. Combining AI across email, documents and spreadsheets day to day is the subject of The AI Productivity Masterclass for Knowledge Workers.
Frequently Asked Questions (FAQ)
Can I really analyze data with AI without knowing any code? Yes, for most business questions. ChatGPT and Copilot in Excel write and run the formulas, Python or SQL for you. What you cannot skip is knowing your data, asking a precise question and checking the result: a wrong number arrives as confidently as a right one.
Should I use ChatGPT or Copilot in Excel for data analysis? Use Copilot in Excel when the data lives in a workbook you maintain and your Microsoft 365 subscription includes it. Use a chat assistant such as ChatGPT to explore, clean and test ideas on an export, as long as your organization has approved the tool for that data.
Does the Excel COPILOT() function still work? No. Microsoft retired it: starting 14 September 2026, the COPILOT function is no longer available in Excel. Microsoft recommends using the Copilot pane instead and describing what you want in your own words.
Do I need to learn Python to use Python in Excel? Not for most uses. Since Microsoft's August 2026 update, Copilot in edit mode can run Python for statistics, simulations, advanced charts and data transformation, with results in your workbook. Availability depends on your subscription, update channel and platform.
How do I know if the AI's numbers are correct? Ask for the formula, code or query used, check the order of magnitude, recompute one group yourself, ask questions whose answers you know, and reconcile the total with a trusted source. A figure that fails a step stays out of your report until you understand why.
Conclusion
Analyzing data with AI without coding is now practical for anyone who works with spreadsheets: a chat assistant for exploration, Copilot in Excel inside your workbook, Python in Excel through Copilot for heavier statistics, and natural-language SQL for databases. The =COPILOT() cell function is gone; use the Copilot pane.
The tools change faster than the fundamentals. A precise question, known data, logged cleaning decisions and a five-step check of every important number separate a useful analysis from a confident mistake. In the example, three small data problems swapped two regions in the ranking. Your real data has more than twelve rows.

The course that continues this article
No-Code Data Analysis with AI: ChatGPT, Excel and SQL for Non-Programmers
You have read the theory. In the course you put it into practice: written lessons structured in modules, with examples and exercises, quizzes, the AI Professor in every lesson and progress saved automatically. Once you complete the lessons and reach the minimum quiz score, you get the Certificate of Completion, a private attestation.
From the course syllabus
- Fundamentals: What AI Can and Cannot Do with Your Data
- ChatGPT Advanced Data Analysis: Upload, Cleaning, Statistics and Charts
- From Business Question to Insight: Formulating Requests on Tabular Data
- Copilot in Excel: AI on Cell Data, Natural-Language Formulas and Pivots
+ 6 more modules in the full syllabus
€99 per month for this course, VAT included · or pick it in a subscription of 3, 5 or 10 courses, from €199 per month, together with other Business courses; you can change them at every renewal (see what you learn across the whole track).
Monthly subscription with automatic renewal · stop the renewal anytime from your account · digital content with immediate access, see the withdrawal conditions. The certificate confirms that you completed the course and is private: it is not a diploma or a state-recognised qualification.